updated on: 7th September 2021
KMeansExample
Whats new?
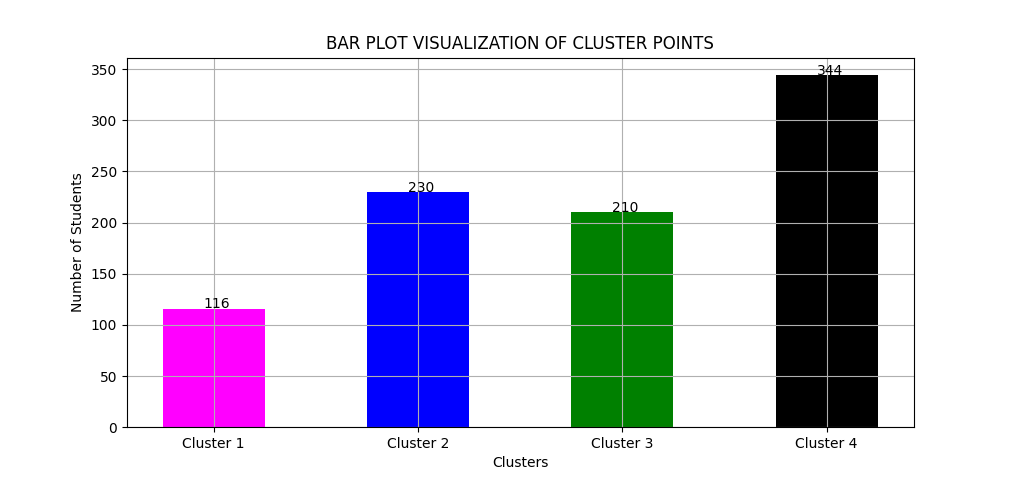
- Bar Plot Visualization of number of points in each cluster
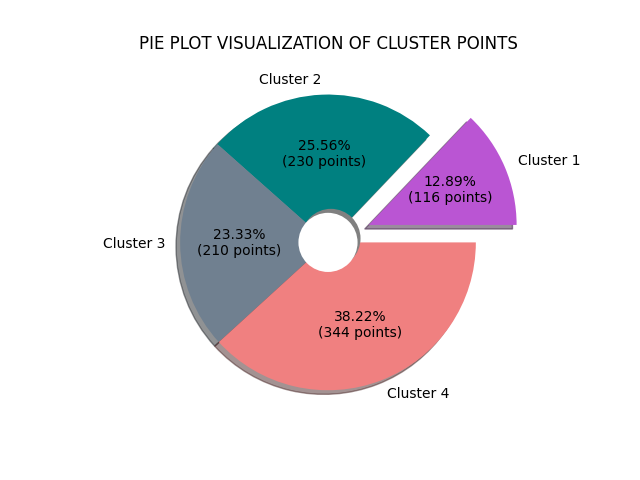
- Pie Plot Visualization of Weightage of Clusters in overall
Table of Contents
Introduction
KMeansExample is a simple implementation of the K Means clustering Algorithm in Python.
Features
- Accurate division of clusters
- Graphic preview of clusters
- Naming of clusters
- Making Predictions
- Bar Chart of number of points per cluster
- Pie Chart of Cluster Weightage
Getting Started
Requirements
KMeansExample Requires these bare-minimum things to work:
- python 3.x - Python 3 and above
- matplotlib for previewing the data . If not installed
$ pip install matplotlib
Installation
KMeansExample doesn’t need to be installed, just run main.py without parameters.
$ python3 main.py
Usage
$ python3 main.py
 **
 Welcome to KMeansExample.
 **
A GUI prompt will open to let you choose a csv file
$ python3 main.py
 **
 Welcome to KMeansExample.
 **

Working on student records at data/test.csv  ..


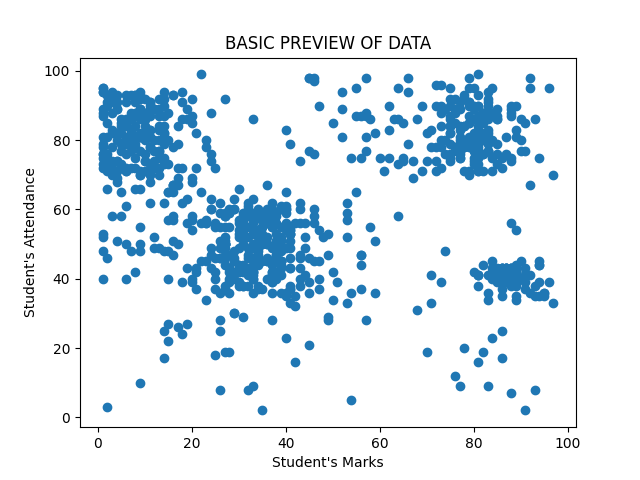
  * (1) for Previewing the records
  * (2) for Proceeding with training
  * (3) for Exiting the predictor
Enter action:
hereafter, the menu interface will guide you.
TODOs
- Add more functionalities
ChangeLog
- See CHANGELOG
Preview for students.csv
- Prediction Tool
  Enter action: 4
  Enter Student's Attendance: 85
  Enter Student's Marks: 90
  Probability for Cluster 1: 77.36%
  Probability for Cluster 2: 61.99%
  Probability for Cluster 3: 93.16%
  Probability for Cluster 4: 67.50%
-
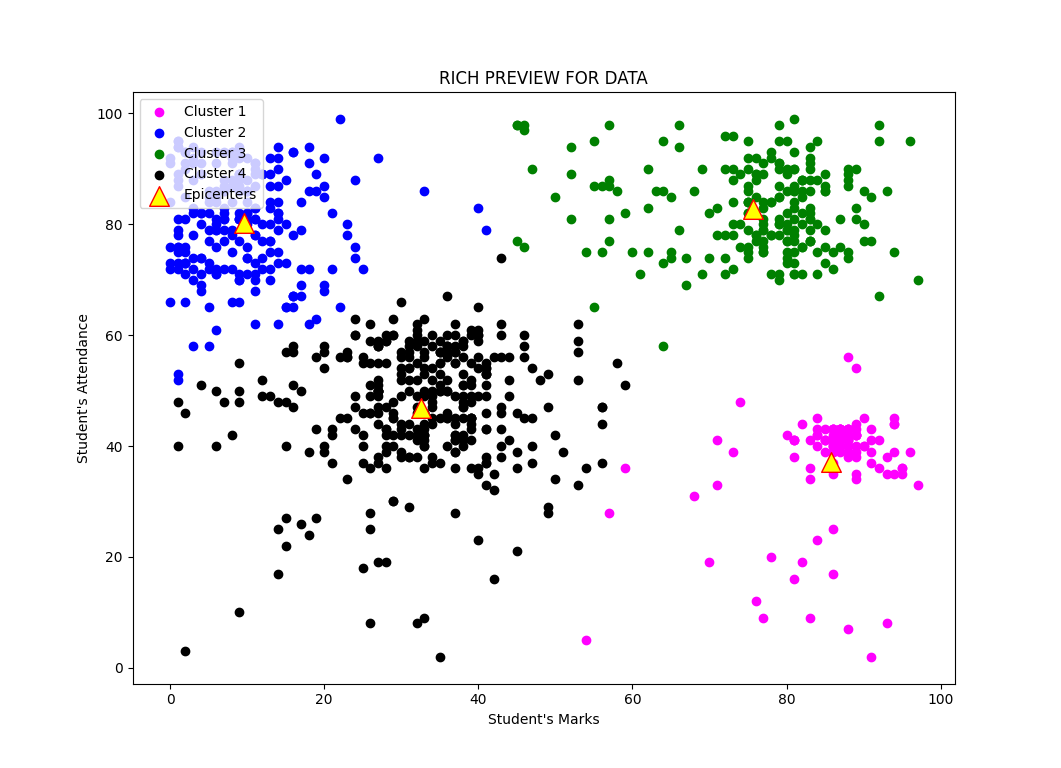
Rich plotting of Clusters

-
Bar Chart Representation

-
Pie Chart Representation

-
Raw Data Records

License
- See LICENSE
Syed Nasim, 2021


